- ×
A data-driven API for interactive thematic maps
Filed under images › 2d graphicsShow Allmapmap.js
A data-driven API for interactive thematic maps
mapmap.js is an API to simplify the creation of interactive thematic vector maps in the browser. It simplifies the processes of loading, processing and joining data and geometry, and applying symbolization and interaction techniques to the map. mapmap.js is built on top of D3 and outputs maps in SVG.
A basic interactive statistical map can be created using mapmap.js like this:
var map = mapmap('#mapEl')
    .geometry('admin.topojson', 'iso') // "iso" is primary key
    .data('population.csv', 'code')    // "code" matches primary key
    .meta({
        'population': {
            label: "District Population",
            valueLabel: "Population",
            domain: [0,200000],
            numberFormat:'0,000',
            color: colorbrewer.YlOrRd[5]
        }
    })
    .choropleth('population')
    .hoverInfo(['name','population'])
    .applyBehavior(mapmap.behavior.zoom())
    .legend(mapmap.legend.html())
;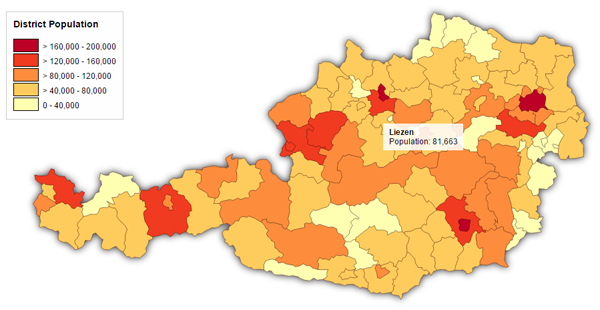
You can find more examples online from the mapmap-examples repository.
For detailed information on the API, see the Programming Guide and API Documentation in the mapmap wiki.
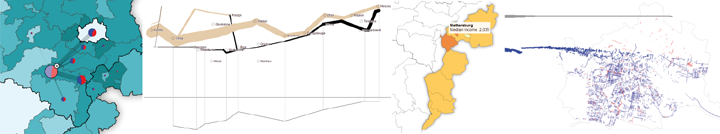
Highlights
Some examples created with mapmap.js
Transparent asynchronous resource loading
mapmap.js handles the loading of geometry and data internally and exposes a pseudo-synchronous API for primary functionality that ensures all resources have been loaded before any operations are performed on them.
// The map will be drawn and the interaction handler installed
// *after* the geometry file has loaded
map.geometry('districts.geojson', 'iso')
   .choropleth('pop_count')
   .on('click', mapmap.zoom());
Metadata specification
Metadata descriptors can be used to define the properties of your data and in many cases help create decent human readable output.
map.geometry('districts.geojson', 'iso')
    .data('population.csv', 'code')
    .meta({
        'pop_count': {
            label: "Population Count, 2014",
            valueLabel: "Population",
            domain: [0,2000000],
            colors: colorbrewer.YlOrRd[5],
            numberFormat: '0,000d' // integer with thousands separator
        }
    })
   .choropleth('pop_count');
(requires colorbrewer.js)
Data joining and processing
Data from CSV or JSON files can be joined with features specified in GeoJSON even if the structure or field names do not match. Simple joins can be performed by specifying the field names that should be used as primary keys to identify matching entities; more complex transformations can be accomplished in a modular fashion by providing functions for the MapReduce programming model.
// Simple use case: Join geometry identified by the property 'iso' with
// data from a CSV where the key field is called 'code'
map.geometry('districts.geojson', 'iso')
   .data('population.csv', 'code')
   .choropleth('pop_count');
// Flexible use case: Process data and/or geometry with MapReduce map.geometry('districts.geojson', 'iso') .data('population.csv', { map: function(d, emit) { // group municipalities by district emit(d.district_code, d); }, reduce: function(key, values, emit) { // sum up population count var result = { pop_count: 0 }; for (var i=0; i<values.length; i++) { result.pop_count += values[i].pop_count; } emit(key, result); } });Read more in the Programming Guide...
Using mapmap.js
To use mapmap.js in the browser, you need to load D3.js before loading mapmap.js.
<script src="http://d3js.org/d3.v3.min.js" charset="utf-8"></script>Internet Explorer and older versions of other browsers also require a polyfill for the Promise object, which is built into newer JavaScript Engines. You can find a polyfill for Promise here (save the file and add a script tag for it), or you may use something like the polyfill.io service.
Then include your downloaded copy of mapmap.js or mapmap.min.js in a script tag.
<script src="mapmap.js"></script>In your HTML code, you need to create an SVG element that is used as the root element of your map. You need to set the width and height attributes of the element to specify the aspect ratio and abstract resolution of your map - you can use CSS to override these and define the actual dimensions of your map.
<svg id="mapEl" width="800" height="400"></svg>In order to correctly position HTML-based information like legends and mouseovers on the map, the SVG element must be descendant of a positioned element, i.e. an element with
position:absolute,relativeorfixed.The most simple map you can create will just render some GeoJSON:
var map = mapmap('#mapEl')
    .geometry('counties.geojson');
Optional dependencies
For processing TopoJSON geometry, you need to include the TopoJSON library from here.
License
mapmap.js is licensed under the GNU Affero General Public License -- this means if you use the library in your project you need to publish the project's source code under a similar license. If this is a problem for you and you want to inquire about other options, contact the author.
Credits
If you use mapmap.js in research and publish a paper about your work, please cite the following publication (BibTex Entry):
Ledermann, F., & Gartner, G. (2015). mapmap.js: A Data-Driven Web Mapping API for Thematic Cartography. In: Proceedings of the 27th International Cartographic Conference (ICC2015), Rio de Janeiro, Brasil.
mapmap.js is created at TU Wien Cartography Group by Florian Ledermann.
Special thanks to Michael N. for testing early versions.
More information
For more information, see the Programming Guide, API Documentation or other pages in the mapmap wiki.
Some examples are provided in a separate repository.
If you have questions or suggestions for improvements, contact me on Twitter or by Email.